Have you heard terms such as Log-Log, Dmax, or OBLA when talking about lactate threshold interpretation? In this article, I’ll be walking you through the different existing methods to find lactate threshold during a lactate threshold step test. The many lactate threshold interpretation methods may seem confusing at first, and that’s because they are! I will try to make sense of them all and share with you the methods of interpretation I use personally.
First, let’s remember that we usually want to determine two lactate thresholds. We will call them “Threshold 1” and “Threshold 2”. Each interpretation method is targeted at one of them. That’s why I’ll separate the article into two sections. In the first section we will focus on finding Lactate Threshold 1. In the second section, we will learn to find Lactate Threshold 2.
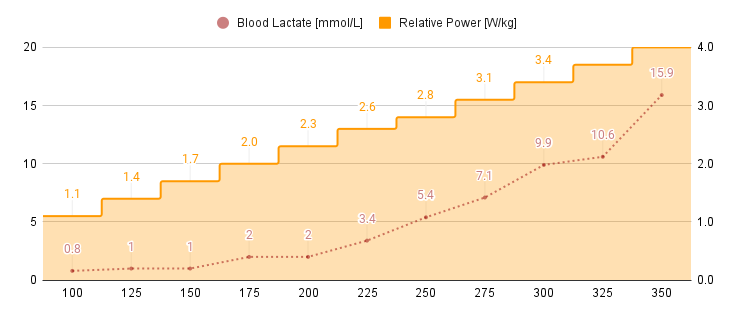
To better illustrate the different interpretation methods, I’ll use a lactate data set that I collected myself a while back using my Protocol 41 approach.
Lactate Threshold 1 Interpretation
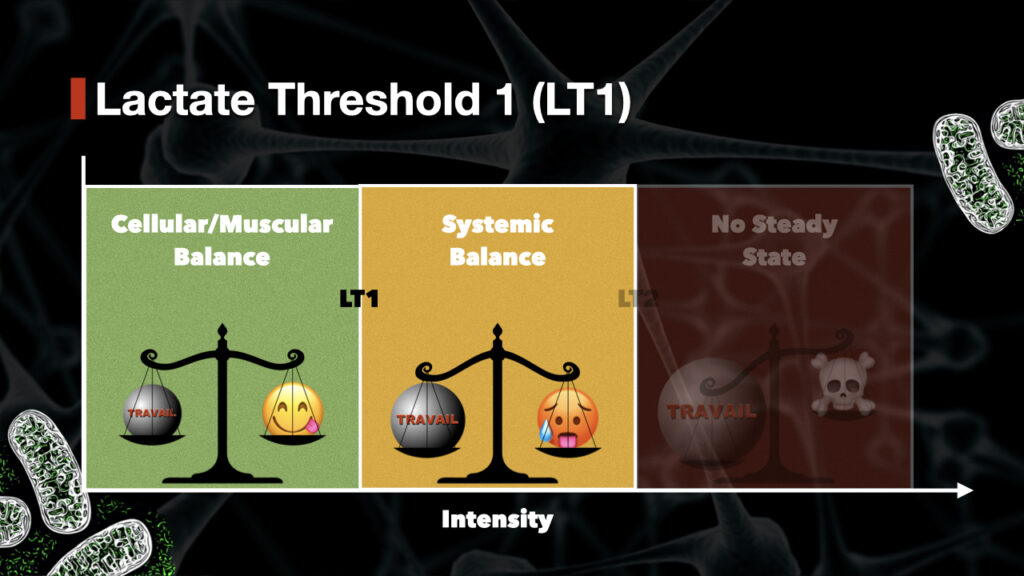
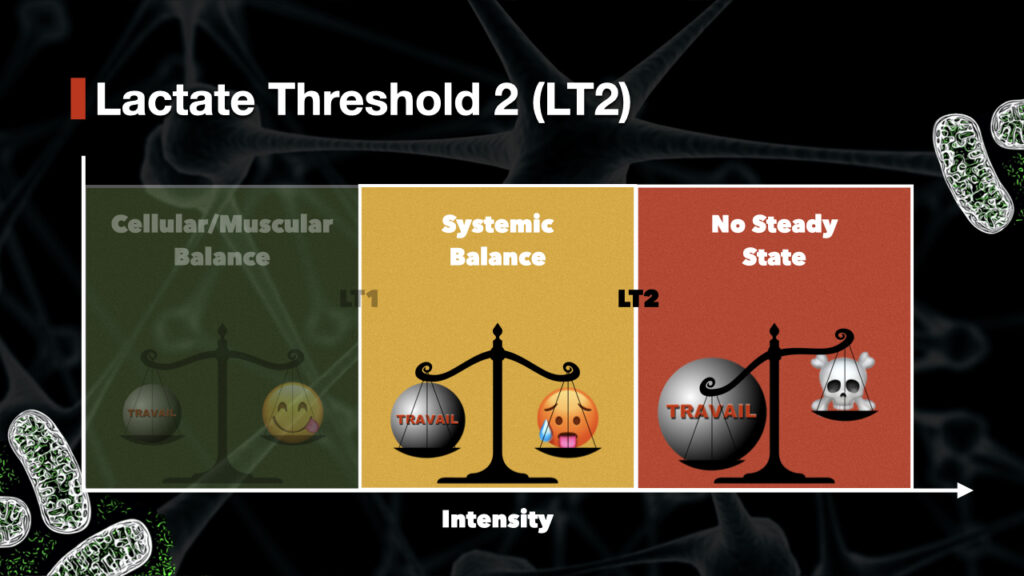
The aim of this section is to find LT1 or lactate threshold 1. Lactate Threshold 1 marks the transition between a cellular/muscular steady state and a systemic steady state. We can use the term “intensity domain” for each state. Below LT1 is the moderate domain. Above LT1 is the heavy domain.
We can use multiple lactate threshold interpretation methods to find LT1. The most common ones are called Log-log, OBLA, Bsln+, LTP, or even LTratio. We will now look at each one more closely.
Log-Log Method to find LT1
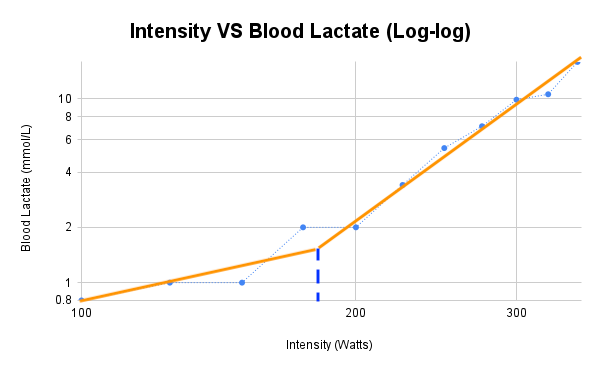
When using the Log-log method, We plot the lactate response against intensity on a logarithmic scale. (i.e., log of lactate vs intensity) The plot is then divided into two segments. Through a segmented regression, we end up with one break point. The exercise intensity at which the breaking point occurs is then considered as Log-log (Beaver et al., 1985) and defined as the first lactate threshold. Caution: in some cases, this method might require a double-check through visual inspection.
LT1 Interpretation using the OBLA Method
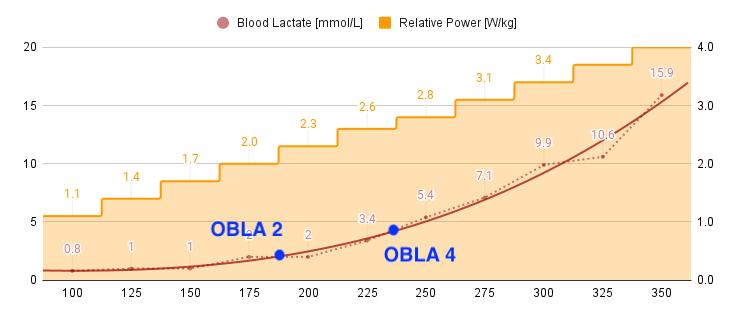
OBLA stands for Onset of Blood Lactate Accumulation. In this interpretation method, we use fixed values of blood lactate to determine thresholds. We fit the lactate curve using a 3rd order polynomial regression curve. Using this method, we can find both LT1 and LT2. Physiologists and coaches used OBLA at 2 mmol/L for LT1 and OBLA at 4 mmol/L for LT2. While these interpretation methods work for some athletes, I would usually advise against using fixed lactate values to find lactate thresholds./spa
More resources on this lactate threshold interpretation method:
Heck et al. (1985), Justification of the 4-mmol/l lactate threshold
Skinner et al. (2013), The Transition from Aerobic to Anaerobic Metabolism
Finding Lactate Threshold 1 using the Bsln+ Method
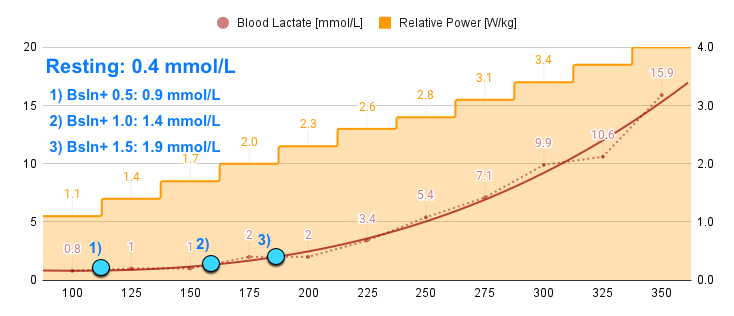
In this method, we use the baseline (resting) lactate as a reference point. From there, we look for the intensity at which lactate increases above this baseline by 0.5, 1, or 1.5 mmol/L. As seen above, we usually fit the lactate curve using a 3rd order polynomial regression curve.
From personal experience, I can say that resting lactate is often quite different from the values we measure at low intensity. In trained individuals, I usually see a drop in lactate between resting levels (pre-test) and the first few samples in the test. In cases where the resting value is significantly higher than the active, low-intensity values, I like to use those active values as the baseline for my interpretation.
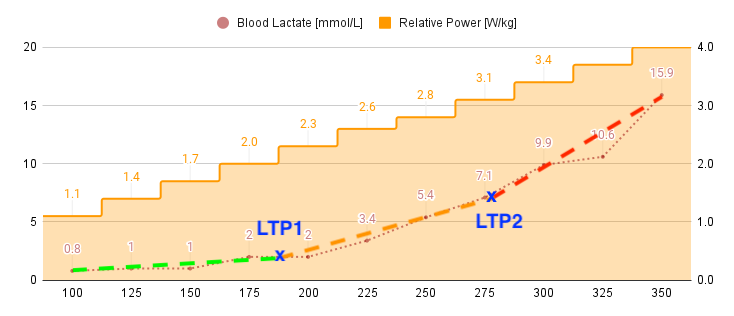
Lactate Threshold Interpretation using Lactate Turning Point 1 (LTP1)
In this method, we divide the lactate response into three segments. This yields two breakpoints. For lactate threshold 1, we look at the first breakpoint.
Additional resources regarding LTP1:
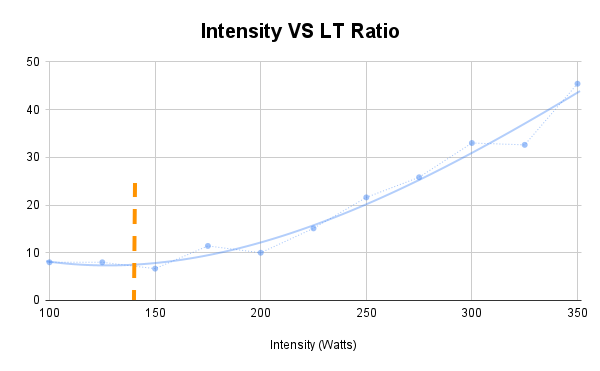
The Lactate Ratio Method for LT1
The lactate ratio method attempts to describe the onset of blood lactate accumulation by plotting the intensity against the lactate/intensity ratio. We then take the lowest point on that curve as lactate threshold 1.
Lactate Threshold 1: What Lactate Threshold Interpretation is Correct?
If we look at the methods we used so far, they yield a number of different interpretations. But how can we decide which one is correct? We can use free software like ExPhysLab to see those different interpretations all at once.
| Method | Intensity | Lactate | Heart Rate |
|---|---|---|---|
| Log-log | 158 | 1.3 | 134 |
| OBLA 2.0 | 188.8 | 2 | 144 |
| OBLA 2.5 | 204.5 | 2.5 | 149 |
| Bsln + 0.5 | 127.1 | 0.9 | 123 |
| Bsln + 1.0 | 163.7 | 1.4 | 135 |
| Bsln + 1.5 | 185.3 | 1.9 | 143 |
| LTP1 | 196.5 | 2.2 | 146 |
| LTratio | 143.2 | 0.8 | 129 |
Based on this data and the different methods of interpretation used, lactate threshold 1 takes place somewhere between 127 and 204 watts. Needless to say that this isn’t very helpful. In order to optimize training, we need more concrete values than a 77w spread.
Finding the right Lactate Threshold Interpretation for you
Based on my test data, training data, and perception of effort, I would place my first threshold around 160 watts. This lines up nicely with the moment I start feeling a strain in the legs and in my breathing (although less so). This also aligns with the baseline (active, not pre-test) + 0.5 mmol/L idea which I find interesting. The moment lactate starts accumulating in the blood, less fat gets oxidized. We produce more stress hormones. The internal state shifts.
With this information, I can then better individualize my training. I know what intensities to use depending on the stimulus I’d like to apply. That being said, there is no perfect interpretation method. We each need to understand the strengths and weaknesses of individual interpretation methods. Some methods might lend themselves better to a specific testing protocol (duration, number of steps, etc..). In the end, we should focus on using methods that align with the way we test and help us improve our training plans as well as better track our athletes’ fitness.
Now that we’ve gone over the different interpretations for LT1, let’s look at the second lactate threshold.
Lactate Threshold 2 Interpretation
Lactate Threshold 2 marks the boundary (or transition) between a systemic steady state and a loss of that internal balance. I sport science talk, we would say that we transition from the heavy intensity domain into the severe intensity domain. In the sever domain, we are no longer able to deal with the different byproducts of metabolism. We have exceeded our maximal oxygen delivery capacity. This means that we will quickly tend to Vo2max and task failure if we sustain the intensity long enough.
LT2 is an important parameter since it helps us parse out where this internal shift occurs. We should note that the transition isn’t clear-cut. A great paper recently highlighted the complicated nature of this second threshold.
We have different interpretation methods to find LT2 using data collected during a lactate step test. These include the OBLA method, the Dmax method, and the LTP method. Let’s have a look at those in a bit more detail.
OBLA & LTP to find Lactate Threshold 2
We already looked over those two methods to determine LT1. To find LT2 using the OBLA method, a fixed value of 4 mmol/L is commonly used. As I mentioned earlier, I’m not so fond of fixed lactate values for thresholds in general. Jan Olbrecht conducted some very interesting work looking at swim speeds at 4 mmol/L with his athletes. He obtained incredible results with these methods. If you’d like to learn more, he describes them well in his book The Science of Winning.
If we look at the LTP method in regard to the second lactate threshold, we have to consider the second breakpoint as illustrated below.
Now that we’ve reviewed the OBLA and the LTP methods, we can dive into looking at the Dmax method and its variations.
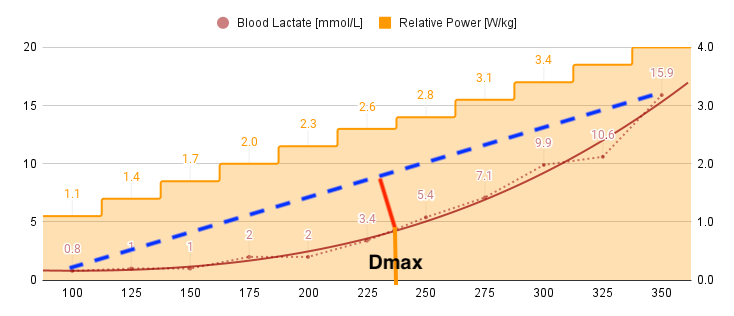
Finding LT2 using the Dmax Method
The Dmax method of interpretation was first described in 1992 by Cheng et al. Using this approach, we find the second lactate threshold by looking at the exercise intensity that “yields the maximum perpendicular distance to the straight line between the first and the last data point”. See the visual representation below:
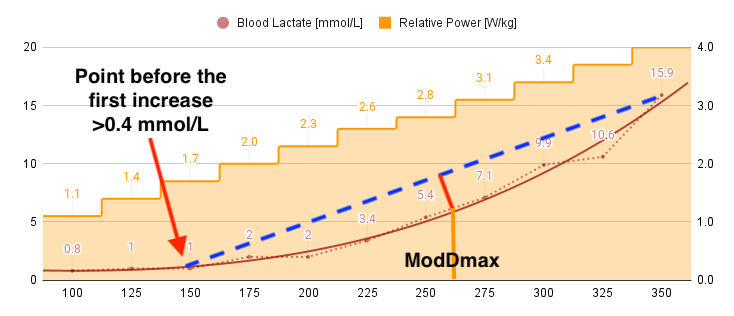
Multiple variations of this Dmax method now exist. The most popular one is probably the Modified Dmax method cited by Bishop et al in 1998. In this method, we use the point that precedes the first increase in lactate above 0.4 mmol/L instead of the first data point. See the visual below:
Additionally, we can also use the Exponential Dmax, the Log-log Modified Dmax or the Log-log exponential Dmax. All these interpretation methods are available on ExPhysLab.com.
Lactate Threshold 2: Finding the Right Interpretation Method
We can look at the ExPhysLab.com data to compare the different interpratation methods:
| Method | Intensity | Lactate | Heart Rate |
|---|---|---|---|
| OBLA 3.0 | 216.7 | 3 | 153 |
| OBLA 3.5 | 227.9 | 3.5 | 157 |
| OBLA 4.0 | 236.9 | 4 | 160 |
| Dmax | 244.9 | 4.4 | 162 |
| ModDmax | 275.7 | 6.6 | 172 |
| Exp-Dmax | 252.6 | 4.9 | 165 |
| Log-Poly-ModDmax | 266.9 | 5.9 | 169 |
| Log-Exp-ModDmax | 270.6 | 6.1 | 171 |
| LTP2 | 323.4 | 11.5 | 188 |
As we saw with LT1, finding LT2 can be a challenge given how many interpretation methods exist. These results range from 216 to 323w, spanning more than 100 watts. From my experience, I’ve found the Modified Dmax method to be the most accurate when comparend to a 40 to 60-minute time trial pace.
But as I said before, you need to understand the upsides and downsides of each interpretation method and determine which one works best for your protocol and planning framework.
Conclusion
As we uncovered in this article, we can use many different methods to find lactate thresholds. The important points to take home are the following:
- Lactate Thresholds aren’t absolutely RIGHT, but they are USEFUL.
- Each interpretation method has its strengths and weaknesses. Get to know them well.
- Pick the right interpretation methods for your chose protocol and situation.
- What matters above all else is the quality/relevance of the way you plan training on the basis of those interpretations, not the interpretations themselves.
Happy training!

Author
Sean Seale – Upside Strength
Sean is a Performance Coach specializing in physiological testing for CrossFit and Endurance Sports athletes (cycling, running, triathlon, swimming, etc.). Sean also works as a consultant and trainer for gym owners, sports organizations (regional and national), and coaches wishing to deepen their knowledge or their approach in this specific area.